A Guide to the EU Pay Transparency Directive 2025 | Download our eGuide for free


Data management
Turn Raw Compensation Data into Action
PayAnalytics clarifies your pay structures through rich visualizations, using your compensation data. Analyze compensation and representation of any demographic, like gender, race, or origin. Accelerate your workplace equity journey by going as granular (or as high-level) as you need.


Put Your Pay Data to Work
With PayAnalytics, import your compensation data in your own way—by downloading data from your HRIS system or via API. Once uploaded, the platform immediately visualizes your pay structures, trends, and anomalies in rich, shareable graphics.
For further work outside the system, export directly to Microsoft O365 products, including Word, Excel, PowerPoint, and PowerBI, or use our API to connect to the data visualization tool of your choice—including Tableau and other enterprise systems.
Refine and Analyze Your Raw Data
At times, your data may need a little extra attention. In PayAnalytics, make refinements to the data you’ve imported—corrections, edits, additions—in an intuitive user interface. All changes are logged, so you always have visibility and up-to-date information, all within a single source of truth. At the same time, labels make it easy to keep track of all datasets you’ve created.
Combine and Compare Datasets
In PayAnalytics, smoothly scale components of part-time and full-time employee compensation data, such as bonuses and base pay, for accurate comparisons—a requirement of some legislation.
You can also combine salary components of your choosing to create new total pay aggregates.
In support of these analyses, you can easily convert among multiple currencies.
Rich Pay Gap Visualizations, at Your Fingertips
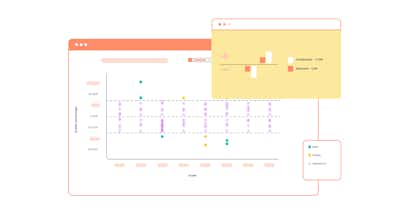
Visualizing your company’s pay structure enables you to immediately identify compensation trends, uncover salary anomalies, and find what’s causing your pay gap.
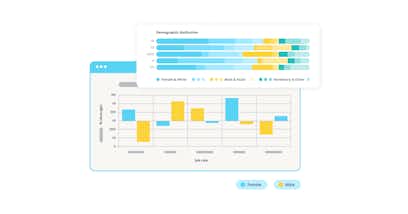
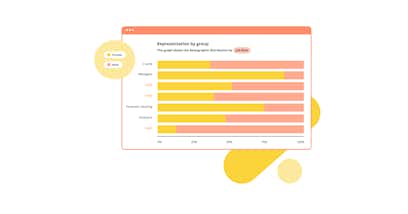
PayAnalytics gives you a visual overview of your data from any angle you choose. You can focus on any variable in your data (for example, grade or job role) and break it down by demographic.
Drill down to see pay distribution at a more granular level—like individual job roles, functional groups, or teams of employees.
Gain Insight with Supporting Data
PayAnalytics supports many types of data—above and beyond the employee level—that may be used in compensation decisions.
- Pay bands: Upload your organization’s pay bands or create bands based on the employee-level data. This will give you a visual understanding of how your employees are placed, so that no employees fall outside of their band.
- Compensation benchmarking: Upload external compensation benchmarking data and to add context to your compensation decisions.
Recommended Resources